Breakthrough at the Bank.
Late last year just before Christmas there was a bit of a breakthrough on inequality at the World Bank, which could have important implications.
After the financial crisis, the IMF led the charge with many innovative and groundbreaking pieces of research on inequality. The World Bank could only bring itself to have a goal focusing on delivering ‘Shared Prosperity’ instead. This was a kind of ‘inequality lite’ where there was a specific focus on the growth of incomes of the bottom 40% but a studious avoidance of any discussion of what is happening at the top. This then became the headline indicator for SDG 10, on Reducing Inequalities- so the main indicator for the inequality SDG doesn’t actually measure inequality.
Given this the decision in December to have a concrete inequality indicator as one of five headline indicators for the World Bank’s new Corporate Scorecard is a big deal. Especially as it was definitely not on the table when the process began. Support from some very influential World Bank Board members, together with a strong coalition of external inequality experts and former World Bank staffers were key to getting this indicator agreed.
What is the indicator? To reduce the number of countries with high inequality. High inequality is defined as having a Gini Coefficient of 0.4 or above. This is about a third of all countries.
It could have been stronger; we were pushing for a goal that sought instead to be positive, to increase the number of countries with low inequality, defined as having a Gini of 0.3 or below. It would also monitor progress of countries too regardless of their level. By focusing on trends in inequality in all countries, it could enable the identification of rising inequality as an issue in wherever it is the case- for example as World Bank country staff have done in Ethiopia, Indonesia, Mongolia, Sierra Leone, and Viet Nam (Gini between 0.35 and 0.4). We will keep pushing for this in World Bank reporting even if it is not the headline indicator.
A renewed boost to tackling inequality in the making.
Still nevertheless, it is a great thing to have this indicator and this new commitment by the World Bank, for which they should be congratulated. It sends an important signal, and will I hope help to drive a renewed interest in inequality, and the proven practical things that can be done to reduce it. It could lead to a strengthening of SDG 10 too, and comes at a time when Brazil has made inequality a key focus of their G20, and the OECD and a number of important donors like the EC, Germany and Norway have all made fighting inequality a priority.
At country level too, it will I hope spark a renewed focus on inequality in quite a few countries.
The last thirty years have seen inequality rise in lots of countries in the global south, but not all. Some, especially in Latin America, have seen inequality reduce, albeit from an extraordinarily high level.
The urgent need for a revolution in inequality data
The data is also very poor, and very sporadic. The last Gini measure for Jamaica was in 2004, twenty years ago. How you calculate your Gini can make a huge difference too; it can be calculated using consumption or using income; and using income tends to give you a higher level. Most countries in Asia use consumption, so their Gini coefficients are often lower. Take India for example, with a 2021 consumption-based Gini of 0.34, inequality is supposedly the same as in Australia. India would therefore not be covered by the new World Bank indicator. Estimates based on income instead give India a Gini coefficient of around 0.5, about the same as Brazil. If this renewed interest on the part of the World Bank and key donor countries leads to a big investment in better, more timely and accurate inequality data that would be a huge contribution.
The next step at the World Bank is the replenishment by donors of IDA, the part of the World Bank that lends money to poorer countries. The same coalition that pushed for the indicator is now pushing for IDA to have ‘Tackling Inequality’ as one of its special themes, and to go further than the corporate scorecard and report on progress towards low and medium levels of inequality too.
At country level, this indicator could mean that World Bank staff are asked to work with country authorities and civil society on plans to reduce inequality.
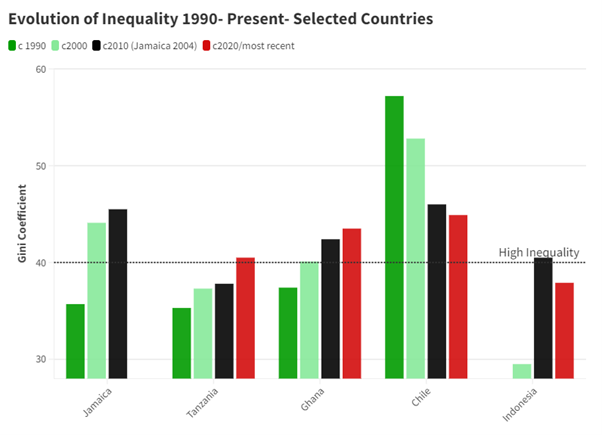
Take Ghana for example; as you can see from the graph above, inequality in Ghana has seen inequality rise sharply over the last thirty years to 0.43. The World Bank could work with the government, with parliament and with civil society to identify what needs to be done to get the Gini coefficient back down under the 0.4 threshold.
In Chile, where the current government was elected on the back of widespread protests about inequality, the World Bank can work with them to see how inequality can be further reduced; after a significant reduction in recent years inequality has plateaued at around 0.44, which is still very high indeed.
In working out what to do to reduce inequality, other very important datasets and analysis can be used- the brilliant work done by the Commitment to Equity institute for example, often in partnership with the World Bank, shows the impact of taxation, social transfers and education and health on the Gini coefficient for example. Their recent Ghana study showed that direct government taxation was progressive, as were education expenditures, whilst health expenditures had no impact on reducing inequality. Hopefully a focus on getting the Gini coefficient down below 0.4 would help spark debate about these vital policy issues like the profound inequalities of the Ghana health system, which is paid for with a VAT surcharge but only available to the better off.
In Chile the impact of taxes, transfers and spending on reducing the Gini coefficient is above average for the region, but half as good as it is in Georgia for example- both start with a similar level of market inequality of 0.49 (that is the level of inequality before any action by government) but in Chile government action gets the Gini down to 0.44 or thereabouts, while the taxing and spending of the Georgian government action gets the Gini down to 0.34.
No politician is likely to win an election with a promise that ‘vote for me and I will lower our Gini coefficient in partnership with the World Bank’- but politically, closing the gap between the richest and the rest is I think very popular, and the practical policies to do so (taxing the rich, health and education for all, pensions, child benefits) are all invariably popular too.
The outgoing President of Indonesia, Jokowi, was elected on just such a platform. He implemented a series of social reforms in healthcare and in social transfers, and the level of inequality has fallen during his tenure, as the graph above shows. He remains hugely popular in Indonesia. There is no doubt he could have done more to close the gap, but he certainly proved that tackling inequality is good politics.
The benefits of reducing inequality are multiple and profound. The ways to reduce inequality are simple and proven. I certainly hope that this new inequality goal at the World Bank helps give a renewed boost to concrete efforts to measure, target and reduce inequality in lots of countries around the world.
END.
Author: Max Lawson, Head of Inequality Policy at Oxfam International and EQUALS podcast co-host. He is also the co-chair of the Global People’s Vaccine Alliance.
Read and subscribe to our EQUALS Substack Newsletter and listen to EQUALS podcast here.


